
We have already discussed in great detail why advanced analytics is crucial when assessing the performance of your team. Deeper analysis of pure numbers can help your players reach a higher level of play, and help with determining the direction in which you want to take your team. Let’s focus on how to actually implement this tool. The three advanced analytics methods we are about to discuss are increasingly being used as indicators of team’s efficiency and provide a clearer picture for coaches when analyzing the data.
Points per Possession (PPP)
PPP= points/possession
Possessions= FGA + 0.44 × FTA – OREB + TO
This advanced analytics tool shows how efficient a player or a team is on offense, comparing the number of points to the number of possessions. While the general concept is pretty simple (we divide the points scored by the number of possessions the team had), this approach gets trickier when we need to calculate possessions of the team or player. Possessions can end in three ways: attempted field goal, attempted free throw, or a turnover. Adding up all these numbers will give us a rough number of original possessions. However, we need to account for offensive rebounds that allow the team to have extra possessions, so we extract the number of offensive rebounds in the formula. The 0.44 factor is used to accurately represent what amount of possessions were used during total free throw attempts. By using this tool coaches can precisely examine how efficient their offenses are, while the application of the same concept to players can identify those who score the most based on the number of possessions they ended. Generally, if a number of points per possession is over 1 it means that the offense is doing something good as the players are, on average, scoring every possession.
True Shooting Percentage (TS%)
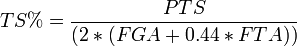
True shooting percentage is an analytical tool that has become one of the most important factors in modern basketball. This approach takes into account the number of points scored compared to the number of shots attempted. The most important thing about this tool is that it doesn’t only count field goals. The emphasis is put on free throws attempted as well, which is very important because free throws are one of the most efficient shots in basketball. The 0.44 factor is once again used to account for possessions used while free throws were being attempted. With true shooting percentages the differences between am average one and a great one are pretty small. An average TS% is around 55% while really efficient players have one north of 60%. Coaches can use this advanced analytics approach to assess how efficient a player is by not being distracted by pure numbers such as points scored.
Effective Field Goal Percentage (eFG%)

Final advanced analytics tool that might be the most popular one is the effective field goal percentage. This one highlights the biggest trend in modern basketball, shooting threes. Since three is worth more than two, the equation gives threes made half more worth to determine exactly how efficient a player was. With this tool, players that bring more points from outside the arc and shoot at a high percentage from three are highlighted. Moreover, this tool doesn’t discriminate non shooters, but simply describes how effective the player is in shooting. Great teams usually have the best effective field goal percentage, as they are the most efficient ones. Like the true shooting percentage, the differences are very small. A good eFG% is usually over fifty percent, but it depends on the level of basketball being played.
The three advanced analytics tools described above best capture the concept of efficiency. Every coach should lean on them when assessing the performance of his team and the opponent. By using them, they can make adjustments according to the findings and look to improve areas the team is struggling in. If the team is successful in all three categories, it is a direct indicator of a great basketball team.