
When reading basketball statistics, people tend to pay attention to traditional counting stats. Too often are we fooled by big numbers from players that like to force shots and play selfishly. As the field of statistics has been popularized, different approaches towards analyzing players emerged as well. It doesn’t matter if the player scored 40 points if the shooting percentage was awful. Thanks to stats such as field goal percentage and also advanced efficiency stats, coaches can decide whether their best scorers are hurting the team from shooting too much. Advanced efficiency statistics deepen the analysis of players, and show how efficient a player is, taking the worth of a shot into account We will explain what these advanced categories of efficiency actually mean, and why they show so much more than regular field goal percentage.
Effective field goal percentage (eFG%)

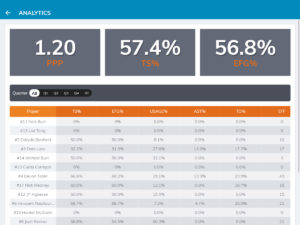
When applied to players from all positions, effective field goal percentage shows how efficient the scorer is based on the fact that perimeter shots are worth three points. To calculate it one has to add the number of field goals made and half the threes made and divide it by the number of field goals attempted. That way, a three-pointer is worth half more than a regular field goal, and by looking at those numbers coaches can decide whether or not the player is hurting the team. It also shows how important the three-pointer has become in modern basketball, as it is worth more.
True shooting percentage (TS%)
x100%

This statistic is very important in modern basketball, as it doesn’t only give importance to the three-point shot, but it also includes the most efficient shot in basketball: free-throws. This stat benefits players who have good percentages from the line and get fouled more frequent. The way this stat helps to see the efficiency of a player is that it combines all the shots including free-throws, and gives a complete picture of how often a player scores. Getting to the foul line has been very important in consistently winning games, which explains why true shooting percentage is an integral part of modern basketball.
Player efficiency rating (PER)
Analysts have long searched for the statistic that would encompass everything that is happening on the basketball court. Although player efficiency rating doesn’t quite do that, it comes awfully close as it accounts for almost all countable basketball stats. Shots made are given certain values based upon average shooting percentages and positive stats add on to it, while shots missed, turnovers, and personal fouls give a player a negative score. However, this statistics does not fully present how does a player perform on the court as some players influence the game without filling up the box score, like defensive specialists. Still, it is a very effective way of evaluating which players are producing the most.
Offensive and defensive rating (ORtg, DRtg)
These two stats are quite often used to evaluate how good the team is performing on both sides of the floor. The numbers work very simple in the case of these statistics. On offense, it accounts for points scored per 100 possessions, while on defense it shows how many points the team allowed per 100 possession. This is very convenient, as teams can be ranked easily depending on their ratings so it gives a clearer picture to which side of the floor the team is oriented. In addition to other tools such as shot charts, coaches can examine these numbers to game plan for their matchups. If a team has a bad offensive rating, that could mean that their opponents can press more and force them to make mistakes, or give up some open perimeter shots, considering teams with lower points per 100 possession usually don’t shoot that good from three. It is a great way of assessing opponents.
These 4 statistical categories are just some examples of analytical efficiency breakthrough in basketball. Although coaches should still rely on the eye test more than just pure numbers, the statistical analysis can provide background for assumptions they make watching the game. With evidence backing them up, they can better present to players where they went wrong and what they need to work on. Moreover, coaches improve in their line of business by seeing when their conclusions are backed up by data. Ultimately, using advance statistics that focus on efficiency helps the team as a whole.