With development of statistics and analytics in basketball, coaches introduced new tools that help understand the game better, and make it easier for them to analyze it. One of the most useful ones is the shot chart, a representation of where players are shooting from, and whether they make it or not. While almost all coaches around the world use these charts, because of the cluster of information that they provide, it is sometimes difficult to make sense of the X’s and O’s. Moreover, if the interpretation is inaccurate, it could lead to wrong decisions from the staff, so it is very important to read shot charts the right way. We’re going to show you how.
Reading the shot chart

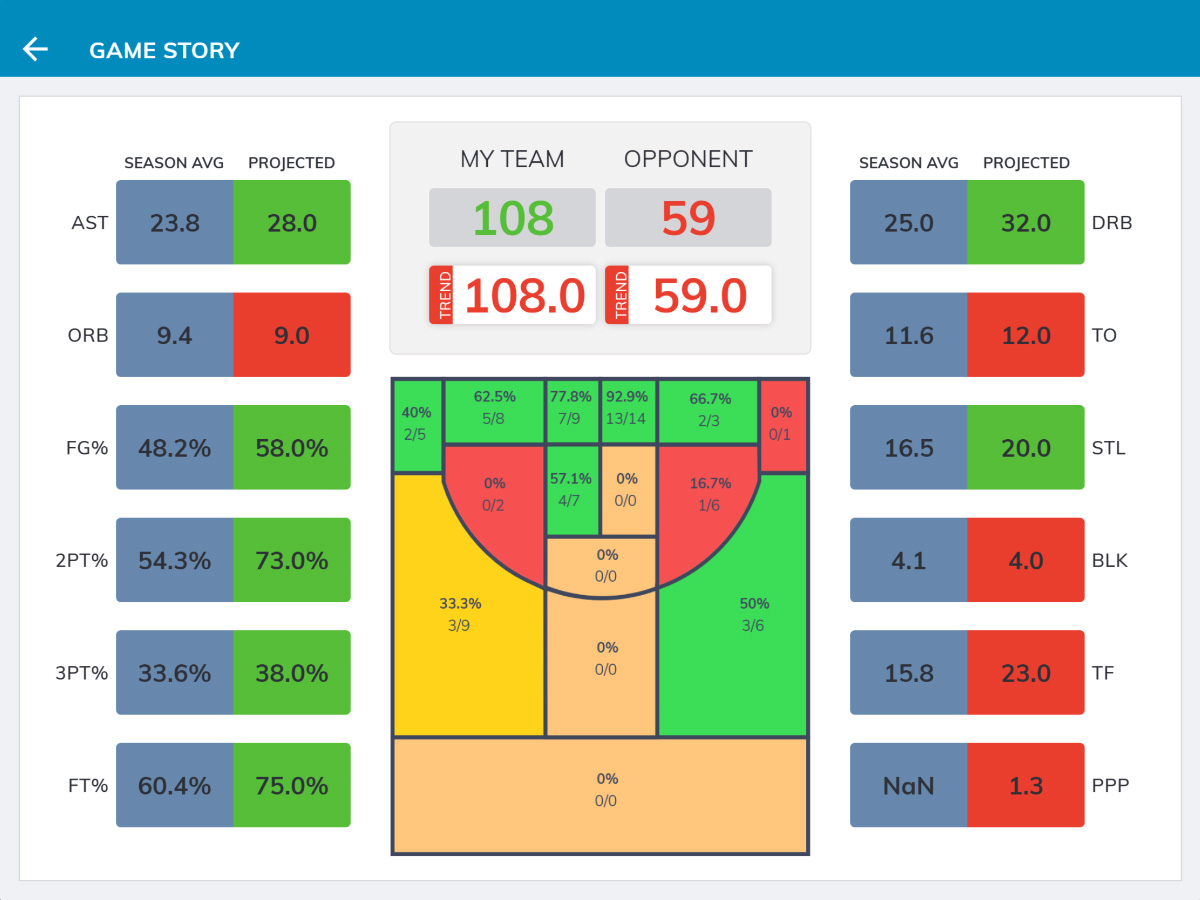
Let’s take this chart as an example. The court is divided into 15 areas and each shot put up is counted in one of those areas. The colors show how good the percentage is in total. Green is above average, yellow is around the average, and red is below average. Percentage of made shots is also shown over each area and you can see the total percentages as well in order to compare them. In this particular chart, it can be seen that the majority of the shots are coming from the left side of the floor. This could mean a variety of things (left handed point guard, right handed shooters coming off screens), but it is for certain that the team is doing something right from the left side of the floor and coaches can use that to keep implementing sets that emphasize shots from those areas. At the same time, coaches can also take note from what areas the team isn’t shooting that well, and modify the attacking approach to avoid shots from there. Not only that, but shot charts can also be used to anticipate what the opponent’s shot selection will be.
Interpreting an offensive system through the shot chart
By now, every coach around the world has studied at least some version of a shot chart in the process of scouting. It is a great tool for figuring out the opponent, as it shows from which area of the court their shots are coming from and at what rate they are hitting them. This could lead to planing out defensive tactics that will force the ball to the areas your opponent isn’t comfortable with. However, this approach is only effective if it is looked upon long term, as single game shot charts tell little about the trends the team is following all season. Let’s take the scenario from our last text as an example. A member of the staff keeps a shot chart of the other team and sees they are shooting very bad from the corners in the ongoing game. Although the team might actually struggle from the corner for whatever reason, we can make assumptions about the opponents offensive system only if the pattern appears during the whole season. It is important not to get seduced by single game statistics, but some observations can be made that could potentially move the scales. The opponent might not be having a great day from three, so occasionally zoning can disrupt their rhythm greatly. The staff can also see where the majority of the shots are coming from and prepare their players on how to guard off ball screens in order to contest these areas to the best of their abilities.
Individual progress through shot charts
Not only coaches benefit from using this tool. Players can see their hot zones, while also seeing which areas they are shooting the worst from. With that kind of information, they can adjust on what areas of their game they need to work on, and start doing shooting drills from red positions on the court to improve. With basketball evolving towards the three point line, shot charts can show from where are the most efficient shots. For example, the corner three was found to be the shot with most statistical value and it is a major component of all modern offenses. However, it can also show which players shouldn’t shoot from certain positions. If the player is a dominant center that scores a lot inside and is all green in the paint, it would be more efficient for the team to work on his inside skills and finishing. Shot charts help the team both through player improvement and player management, lifting your team to be as efficient as possible.